Note
Go to the end to download the full example code.
Generate Gaussian Models
imports
import crtomo
import matplotlib.pylab as plt
we need a tomodir object
grid = crtomo.crt_grid(
    'grid_anomalies/elem.dat',
    'grid_anomalies/elec.dat',
    # 'grid_surface/elem.dat', 'grid_surface/elec.dat'
)
tdm = crtomo.tdMan(grid=grid)
This grid was sorted using CutMcK. The nodes were resorted!
Triangular grid found
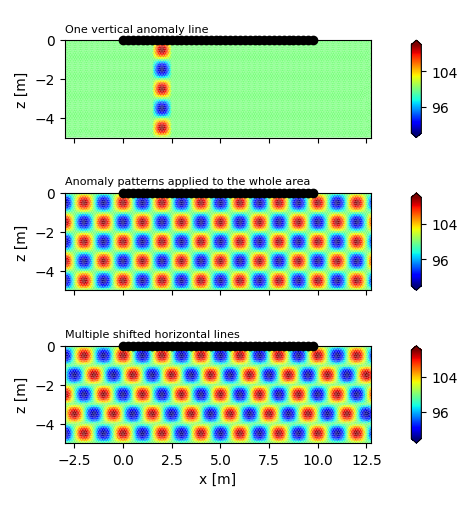
Create a cos(x)cos(y) anomaly
fig, axes = plt.subplots(
    3, 1,
    sharex=True,
    figsize=(12 / 2.54,  13 / 2.54),
)

ax = axes[0]

pid_rmag, rpha = tdm.add_homogeneous_model(100, 0)

p0 = [2.0, -2.5]
anomaly_width = 1
anomaly_height = 1
peak_value = 10

tdm.parman.add_2d_cos_anomaly_line(
    pid_rmag,
    p0=[2, -0.5],
    anomaly_width=1,
    anomaly_height=1,
    peak_value=10,
    area='only_one_x',
)
tdm.plot.plot_elements_to_ax(
    pid_rmag,
    ax=ax,
    plot_colorbar=True,
    cmap_name='jet',
)
ax.set_title('One vertical anomaly line', loc='left', fontsize=8)

ax = axes[1]

pid_rmag, rpha = tdm.add_homogeneous_model(100, 0)

p0 = [2.0, -2.5]
anomaly_width = 1
anomaly_height = 1
peak_value = 10

tdm.parman.add_2d_cos_anomaly_line(
    pid_rmag,
    p0=[2, -0.5],
    anomaly_width=1,
    anomaly_height=1,
    peak_value=10,
    area='all',
)

tdm.plot.plot_elements_to_ax(
    pid_rmag,
    ax=ax,
    plot_colorbar=True,
    cmap_name='jet',
)

ax.set_title(
    'Anomaly patterns applied to the whole area', loc='left', fontsize=8)

ax = axes[2]

pid_rmag, rpha = tdm.add_homogeneous_model(100, 0)

p0 = [2.0, -2.5]
anomaly_width = 1
anomaly_height = 1
peak_value = 10

tdm.parman.add_2d_cos_anomaly_line(
    pid_rmag,
    p0=[0, -0.5],
    anomaly_width=1,
    anomaly_height=1,
    peak_value=10,
    area='only_one_y',
)
tdm.parman.add_2d_cos_anomaly_line(
    pid_rmag,
    p0=[0.5, -1.5],
    anomaly_width=1,
    anomaly_height=1,
    peak_value=10,
)
tdm.parman.add_2d_cos_anomaly_line(
    pid_rmag,
    p0=[1.0, -2.5],
    anomaly_width=1,
    anomaly_height=1,
    peak_value=10,
)
tdm.parman.add_2d_cos_anomaly_line(
    pid_rmag,
    p0=[1.5, -3.5],
    anomaly_width=1,
    anomaly_height=1,
    peak_value=10,
)
tdm.parman.add_2d_cos_anomaly_line(
    pid_rmag,
    p0=[2.0, -4.5],
    anomaly_width=1,
    anomaly_height=1,
    peak_value=10,
)

# tdm.parman.add_checkerboard_pattern(
#     pid_rmag,
#     [0, -0.5],
#     1,
#     1,
#     10,
# )

tdm.plot.plot_elements_to_ax(
    pid_rmag,
    ax=ax,
    plot_colorbar=True,
    cmap_name='jet',
)
ax.set_title('Multiple shifted horizontal lines', loc='left', fontsize=8)

axes[0].set_xlabel('')
axes[1].set_xlabel('')
fig.tight_layout()
fig.savefig('out_cos.jpg', dpi=300)

# fig, ax = plt.subplots()
# tdm.grid.plot_grid_to_ax(ax)

model already set, will overwrite
model already set, will overwrite
create a new parameter set with one anomaly

create another new parameter set with one anomaly

add an additional anomaly to this parset
