Note
Go to the end to download the full example code.
Using Inkscape to define internal structure
It is possible to use Inkscape to define some of the internal structure of a FE mesh. This can be used to:
define irregularly-shaped regions within a forward mesh
define internal geometry that is later used for decoupling of the regularization
More information:
The basic procedure is as follows:
Create input files for triangular mesh generation as usual: boundaries.dat, electrodes.dat
Following that, generate a .svg template of the mesh boundary by running grid_convert_boundary_to_svg
import os
import shutil

import reda
import subprocess
import numpy as np
import crtomo
from shapely.geometry import Polygon
import matplotlib.pylab as plt
We will store all output of this example in a subdirectory. Delete the directory before proceeding
if os.path.isdir('tmp_triag_inkscape'):
    shutil.rmtree('tmp_triag_inkscape')
Note: We use the contextmanager
reda.utils.enter_directory.CreateEnterDirectory to transparently
change our working directory. This ensures that all output files/directories
will be placed in the tmp_triag_inkscape directory
with reda.CreateEnterDirectory('tmp_triag_inkscape'):
    with open('electrodes.dat', 'w') as fid:
        fid.write("""0.0 0.0
5.0 0.0
10.0 0.0
15.0 0.0
""")

    with open('boundaries.dat', 'w') as fid:
        fid.write("""-10.0000 0.0000 12
0.0000 0.0000 12
5.0000 0.0000 12
10.0000 0.0000 12
15.0000 0.0000 12
25.0000 0.0000 11
25.0000 -10.0000 11
-10.0000 -10.0000 11""")
The grid_convert_boundary_to_svg commands takes a boundaries.dat file and turns it into a simple svg file that can be opened with Inkscape. Geometry is now added using straight lines. Each region is stored in a new layer, whose name starts with region_ The output file is saved as out_modified2.svg with the type “Inkscape SVG”
with reda.CreateEnterDirectory('tmp_triag_inkscape'):
    subprocess.call('grid_convert_boundary_to_svg', shell=True)

# note: here we copy a pre-modified svg file
with reda.CreateEnterDirectory('tmp_triag_inkscape'):
    shutil.copy('../data_02/out_modified2.svg', 'out_modified2.svg')

# this command parses the out_modified2.svg file and creates multiple output
# files
with reda.CreateEnterDirectory('tmp_triag_inkscape'):
    subprocess.call('grid_parse_svg_to_files', shell=True)

with reda.CreateEnterDirectory('tmp_triag_inkscape'):
    shutil.copy('lne_constraint_1.dat', 'extra_lines.dat')

with reda.CreateEnterDirectory('tmp_triag_inkscape'):
    subprocess.call('cr_trig_create grid', shell=True)
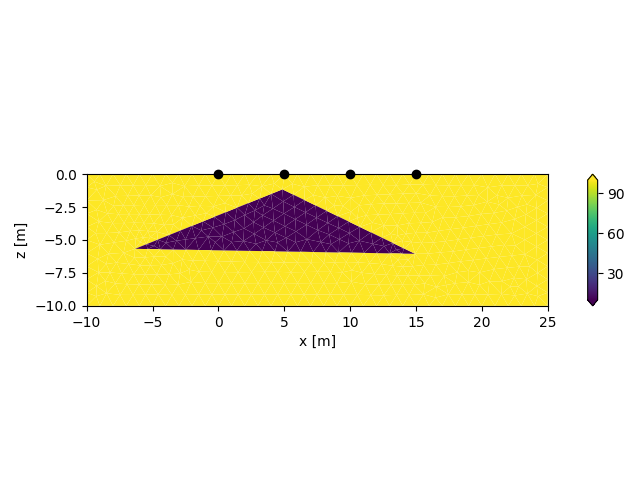
Plot the resulting CRMod/CRTomo mesh
with reda.CreateEnterDirectory('tmp_triag_inkscape'):
    grid = crtomo.crt_grid(
        elem_file='grid/elem.dat',
        elec_file='grid/elec.dat',
    )
    pm = crtomo.ParMan(grid)
    pid = pm.add_empty_dataset(100)
    region_lines = np.loadtxt('all_constraint_1.dat')

    poly = Polygon(
        np.vstack(
            (region_lines[:, 0:2], region_lines[-1, 2:4])
        )
    )
    pm.modify_polygon(pid, poly, 10)

    plotman = crtomo.pltMan(pm=pm, grid=grid)

    fig, ax = plt.subplots()
    plotman.plot_elements_to_ax(
        pid,
        plot_colorbar=True,
        ax=ax,
    )
    fig.tight_layout()
    fig.savefig('model.jpg', dpi=300)

This grid was sorted using CutMcK. The nodes were resorted!
Triangular grid found
Now we can create a decouplings.dat file that can be used by CRTomo to decouple regularization between adjacent cells
usage: grid_extralines_gen_decouplings [-h] [-e ELEM_FILE] [--eps EPS]
                                       [-w ETA] [-l LINEFILE] [-o FILE]
                                       [-linenr LINE_NR] [--debug_plot]
                                       [--plot_node_nrs] [--plot_elm_nrs]

options:
  -h, --help            show this help message and exit
  -e ELEM_FILE, --elem ELEM_FILE
                        elem.dat file (default: elem.dat)
  --eps EPS             User override for distance eps
  -w ETA, --eta ETA     User override for coupling coefficient (default: 0)
  -l LINEFILE, --linefile LINEFILE
  -o FILE, --output FILE
                        Output file (default: decouplings.dat)
  -linenr LINE_NR, --ln LINE_NR
                        Process only one line with index N (zero indexed)
  --debug_plot          plot a debug plot
  --plot_node_nrs       plot node numbers in the debug plot. default: False
  --plot_elm_nrs        plot elements numbers in the debug plot. default:
                        False
with reda.CreateEnterDirectory('tmp_triag_inkscape'):
    subprocess.call(
        'grid_extralines_gen_decouplings -e grid/elem.dat '
        '-l lne_constraint_1.dat --debug_plot --eta 0.7',
        shell=True
    )