Note
Go to the end to download the full example code.
Another three data sets
Data sets from:
Decay curve analysis for data error quantification in time-domain induced polarization imaging Adrian Flores Orozco, Jakob Gallistl, Matthias Bücker, and Kenneth H. Williams GEOPHYSICS 2018 83:2, E75-E86
https://doi.org/10.1190/geo2016-0714.1
import reda
normal loading of tdip data
ip = reda.TDIP()
# with profiler():
ip.import_syscal_bin('data_syscal_ip_2/l1sk0n_1.bin')

print(ip.data[['a', 'b', 'm', 'n', 'id', 'norrec']])

# import IPython
# IPython.embed()
# exit()
      a   b   m   n   id norrec
0     1   2   3   4    0    nor
1     1   2   4   5    1    nor
2     1   2   5   6    2    nor
3     1   2   6   7    3    nor
4     1   2   7   8    4    nor
..   ..  ..  ..  ..  ...    ...
560  59  60  62  63  560    nor
561  59  60  63  64  561    nor
562  60  61  62  63  562    nor
563  60  61  63  64  563    nor
564  61  62  63  64  564    nor

[565 rows x 6 columns]
you can also specify only one index this will only return a figure object, but will not save to file:
ip.plot_decay_curve(
    filename='decay_curve.png', index_nor=0, return_fig=True)
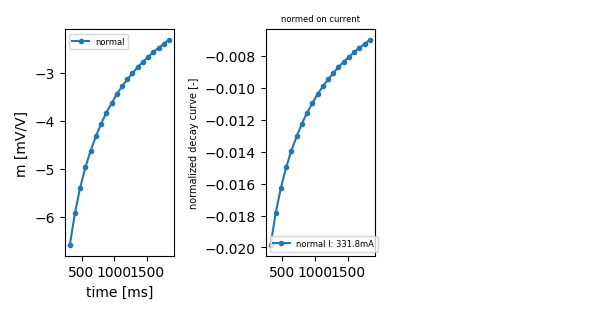
<Figure size 590.551x314.961 with 3 Axes>