Note
Go to the end to download the full example code.
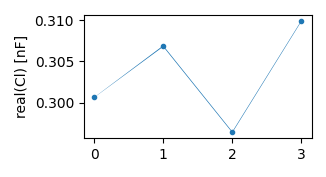
Analyzing total capacitances at each electrode during current injection
It is useful to conduct additional measurements for each sEIT setup and determine the total capacitances seen by each electrode during current excitation. This parameter is helpful in assessing leakages and general electrical flow paths with respect to system ground.
For more information, see:
Zimmermann, E., Huisman, J. A., Mester, A., and van Waasen, S.: Correction of phase errors due to leakage currents in wideband EIT field measurements on soil and sediments, Measurement Science and Technology, 30, 084 002, doi:10.1088/1361-6501/ab1b09, 2019.

selecting multiplexer group 1
Available frequencies: [  500.  1000.  5000. 10000.]
import matplotlib.pylab as plt
import numpy as np

import reda
import reda.importers.eit_fzj as eit_fzj

md_data = eit_fzj.get_md_data(
    'data_eit_fzj_li/eit_data.mat', multiplexer_group=1
)
print('Available frequencies:', np.unique(md_data['frequency'].values))
data_1k = md_data.query('frequency == 1000')

# convert to [nF]
Cl_1k_nF = np.abs(data_1k[['Cl1', 'Cl2', 'Cl3']] / 1e-9)

min_Cl = np.min(Cl_1k_nF[['Cl1', 'Cl2', 'Cl3']], axis=1)
max_Cl = np.max(Cl_1k_nF[['Cl1', 'Cl2', 'Cl3']], axis=1)
mean_Cl = np.mean(Cl_1k_nF[['Cl1', 'Cl2', 'Cl3']], axis=1)

fig, ax = plt.subplots(1, 1, figsize=(8.3 / 2.54, 4.5 / 2.54))
ax.fill_between(
    range(0, len(mean_Cl)), y1=np.real(min_Cl), y2=np.real(max_Cl)
)
ax.plot(np.real(mean_Cl), '.')
ax.set_ylabel('real(Cl) [nF]')
fig.tight_layout()

with reda.CreateEnterDirectory('output_eit_fzj_li'):
    fig.savefig('electrode_capacitances.jpg', dpi=300)
