Note
Go to the end to download the full example code.
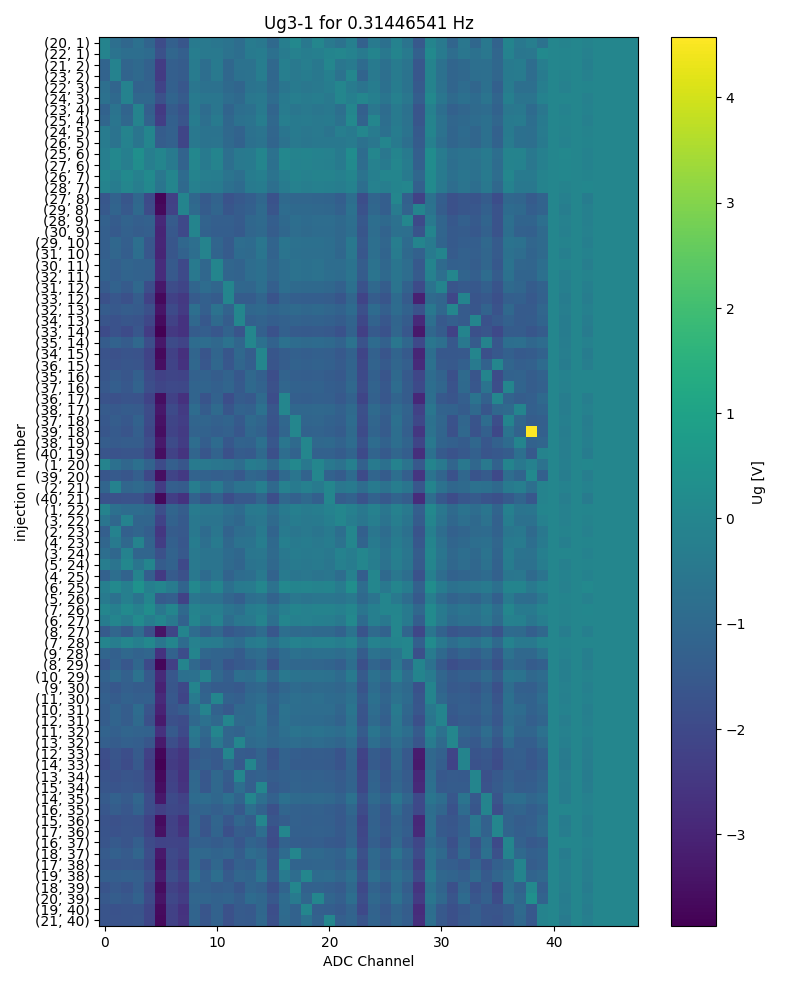
EIT-FZJ: Analyze DC voltages at electrodes during injections

import matplotlib.pylab as plt

import reda
import reda.importers.eit_fzj as eit_fzj

adc_data = eit_fzj.get_adc_data('data_eit_fzj_2013_ug/eit_data_mnu0.mat')

with reda.CreateEnterDirectory('output_04_ug3'):
    frequencies = list(
        adc_data.swaplevel(0, 2).groupby('frequency').groups.keys())
    # frequency to plot
    frequency = frequencies[1]

    fig, ax = plt.subplots(
        1, 1, figsize=(20 / 2.54, 25 / 2.54),
        sharex=True, sharey=True)

    subdata = adc_data.swaplevel(0, 2).loc[frequency]
    im = ax.imshow(
        subdata.swaplevel(0, 1, axis=1)['Ug3_1'].values,
        interpolation=None,
    )
    ax.set_aspect('auto')

    ax.set_yticks(list(range(subdata.index.shape[0])))
    ax.set_yticklabels(subdata.index.droplevel(2).values)

    cb = fig.colorbar(im, ax=ax)
    cb.set_label(r'Ug [V]')
    # ax.set_ylim(0, 10)

    ax.set_title('Ug3-1 for {} Hz'.format(frequency))
    ax.set_ylabel('injection number')

    ax.set_xlabel('ADC Channel')

    fig.tight_layout()
    fig.savefig('plot_ug3-1.pdf', dpi=300)
