Note
Go to the end to download the full example code.
Importing Syscal ERT data from roll-a-long scheme
import reda
create an ERT container and import first dataset The ‘elecs_transform_reg_spacing_x’ parameter transforms the spacing in x direction from the spacing stored in the data file (here 1 m) to the true spacing of 0.2 m. This is useful if the spacing on the measurement system is not changed between measurements and only changed in the postprocessing (this is common practice in some work groups).
ert_p1 = reda.ERT()
ert_p1.import_syscal_bin(
    'data_syscal_rollalong/profile_1.bin',
    elecs_transform_reg_spacing_x=(1, 0.2),
)
ert_p1.compute_K_analytical(spacing=0.2)
with reda.CreateEnterDirectory('output_02_rollalong'):
    ert_p1.pseudosection(
        filename='profile1_pseudosection.pdf',
        column='r', log10=True
    )
found duplicate coordinates!
Print statistics
ert_p1.print_data_journal()
--- Data Journal Start ---
2026-05-19 07:37:42.148398
Data was imported from file  (1460 data points)
--- Data Journal End ---
This here is an activity list
ert_p1.print_log()
2026-05-19 07:37:41,756 - reda.containers.BaseContainer - INFO - IRIS Syscal Pro bin import
2026-05-19 07:37:42,000 - reda.containers.BaseContainer - INFO - Data sized changed from 0 to 1460
create an ERT container and import second dataset
ert_p2 = reda.ERT()
ert_p2.import_syscal_bin(
    'data_syscal_rollalong/profile_2.bin',
    elecs_transform_reg_spacing_x=(1, 0.2),
)
ert_p2.compute_K_analytical(spacing=0.2)
with reda.CreateEnterDirectory('output_02_rollalong'):
    ert_p2.pseudosection(
        filename='profile2_pseudosection.pdf',
        column='r',
        log10=True
    )
found duplicate coordinates!
Again print the data journal to see what changed in terms of imported data points
ert_p2.print_data_journal()
--- Data Journal Start ---
2026-05-19 07:37:42.542174
Data was imported from file  (1460 data points)
--- Data Journal End ---
Now we start over again and fix the coordinates of the second profile by using the ‘shift_by_xyz’ parameter, which can be used to move the electrode positions by a fixed offset. In our case this offset amounts to the position of the 25th position (first electrode starts at 0, therefore 24 * 0.25 m).
ert = reda.ERT()

# first profile
ert.import_syscal_bin(
    'data_syscal_rollalong/profile_1.bin',
    elecs_transform_reg_spacing_x=(1, 0.2),
)

ert2 = reda.ERT()
# second profile
ert2.import_syscal_bin(
    'data_syscal_rollalong/profile_2.bin',
    elecs_transform_reg_spacing_x=(1, 0.2),
    shift_by_xyz=[24 * 0.2],
)
Electrode positions of first dataset
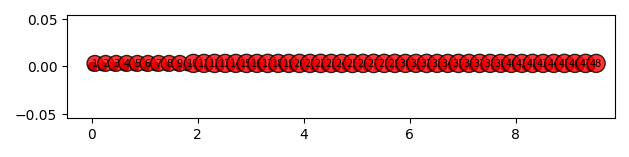
Electrode positions of second dataset

Now we merge the datasets and plot the electrode positions

compute geometric factors
ert.compute_K_analytical(spacing=0.2)
array([ -3.76991118,  -3.76991118, -15.07964474, ...,  15.07964474,
         3.76991118,  -3.76991118], shape=(2920,))
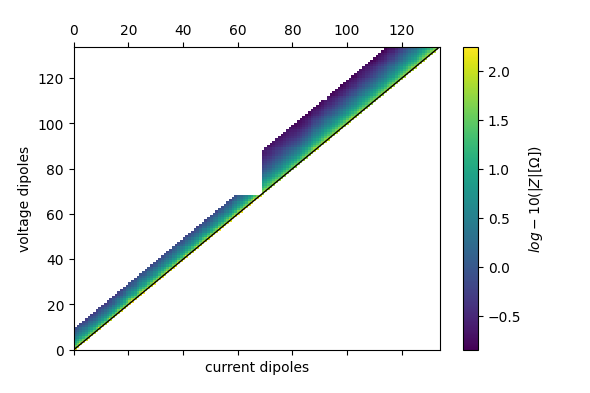
Plot Pseudosection
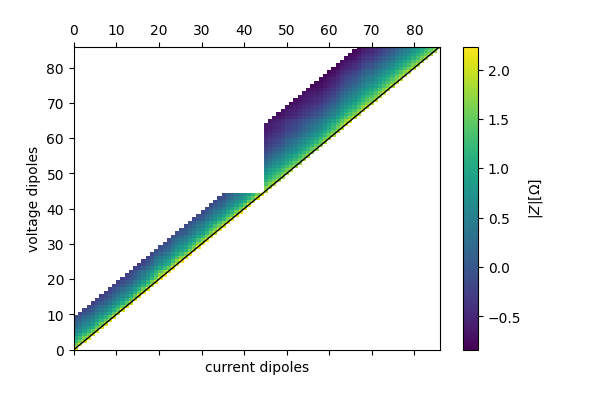
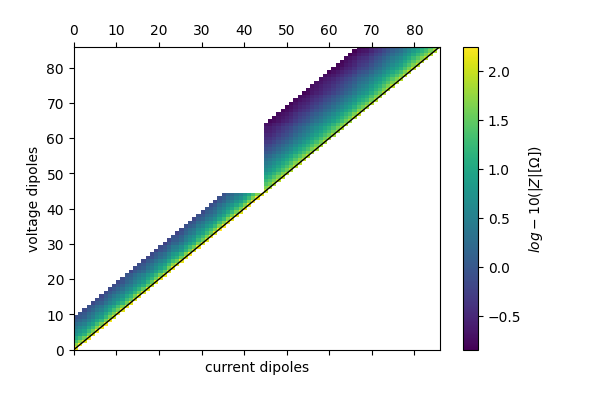
with reda.CreateEnterDirectory('output_02_rollalong'):
    ert.pseudosection(filename='pseudosection_both_profiles.pdf',
                      column='r', log10=True)
found duplicate coordinates!
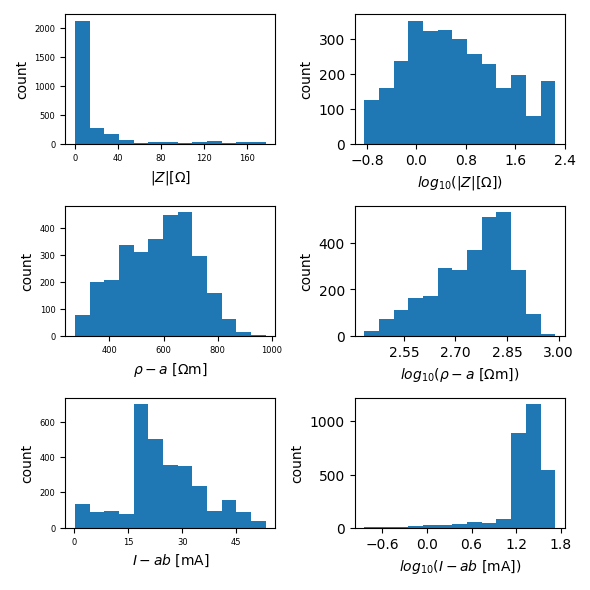
with reda.CreateEnterDirectory('output_02_rollalong'):
    ert.histogram(filename='hist_both_profiles.pdf',
                  column=['r', 'rho_a', 'Iab', ])