Note
Go to the end to download the full example code.
Exporting to pygimli for ERT inversion
REDA can also export to pygimli (https://www.pygimli.org/) ert data containers.
# sphinx_gallery_thumbnail_number = 3
import reda
import pygimli as pg
from pygimli.physics import ert
import data into reda, including electrode information
data = reda.ERT()
data.import_syscal_bin('../01_ERT/data_rodderberg/20140208_01.bin')
data.import_electrode_positions(
'../01_ERT/data_rodderberg/electrode_positions.dat',
)
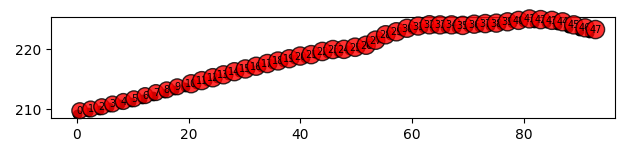
# plot the electrode positions
data.plot_electrode_positions_2d()
19/05/26 - 07:39:12 - reda.containers.BaseContainer - INFO - IRIS Syscal Pro bin import
19/05/26 - 07:39:12 - reda.containers.BaseContainer - INFO - Data sized changed from 0 to 2816

(<Figure size 629.921x157.48 with 1 Axes>, None)
compute geometric factors
data.compute_K_numerical(fem_code='pygimli')
Computing geometric factors using PyGimli
Computing numerical geometric factors using Pyglimi
19/05/26 - 07:39:12 - pyGIMLi - INFO - Create default mesh for geometric factor calculation.
19/05/26 - 07:39:13 - pyGIMLi - INFO - Save RVector binary
19/05/26 - 07:39:13 - pyGIMLi - INFO - Cache stored: /home/runner/.cache/pygimli/5132418002377825291

array([ -38.52402364, -153.52866075, -378.10597767, ...,  -38.54919138,
       -171.86663742,  -42.25692476], shape=(2816,))
apply some light filtering
data.filter('rho_a <= 0')
19/05/26 - 07:39:13 - reda.containers.BaseContainer - INFO - Data sized changed from 2816 to 2816

<reda.containers.ERT.ERT object at 0x7fd3c1f27580>
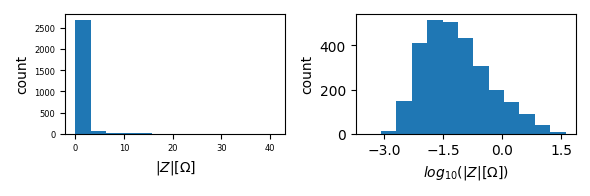
plot histograms
with reda.CreateEnterDirectory('output_01_ertinv'):
    data.histogram('r', log10=True, filename='histograms_raw.jpg')
export the data (and electrode positions) into a pygimli data container
pg_scheme = data.export_to_pygimli_scheme()
WARNING: Implementation and testing still in progress!!!!
WARNING: Journal and log is not copied!
set data errors
pg_scheme.estimateError(relativeError=0.01, absoluteUError=7e-5)

mgr = ert.ERTManager(pg_scheme)
with reda.CreateEnterDirectory('output_01_ertinv'):
    mod = mgr.invert(
        pg_scheme,
        lam=10,
        verbose=True,
        paraDX=0.1,
        paraMaxCellSize=10,
        paraDepth=20,
        quality=33.0
    )
19/05/26 - 07:39:14 - pyGIMLi - INFO - Found 2 regions.
19/05/26 - 07:39:14 - pyGIMLi - INFO - Region with smallest marker set to background (marker=1)
19/05/26 - 07:39:14 - pyGIMLi - INFO - Found 2 regions.
19/05/26 - 07:39:14 - pyGIMLi - INFO - Region with smallest marker set to background (marker=1)
19/05/26 - 07:39:14 - pyGIMLi - INFO - Creating forward mesh from region infos.
19/05/26 - 07:39:14 - pyGIMLi - INFO - Creating refined mesh (H2) to solve forward task.
19/05/26 - 07:39:14 - pyGIMLi - INFO - Mesh for forward task: Mesh: Nodes: 5239 Cells: 9904 Boundaries: 7714
19/05/26 - 07:39:14 - pyGIMLi - INFO - Use median(data values)=96.18936845699685
19/05/26 - 07:39:14 - pyGIMLi - INFO - Created startmodel from forward operator:2008, min/max=96.189368/96.189368
19/05/26 - 07:39:14 - pyGIMLi - INFO - Starting inversion.
19/05/26 - 07:39:14 - pyGIMLi - INFO - fop: <pygimli.physics.ert.ertModelling.ERTModelling object at 0x7fd3cccb3470>
19/05/26 - 07:39:14 - pyGIMLi - INFO - Data transformation: Logarithmic LU transform, lower bound 0.0, upper bound 0.0
19/05/26 - 07:39:14 - pyGIMLi - INFO - Model transformation: Logarithmic transform
19/05/26 - 07:39:14 - pyGIMLi - INFO - min/max (data): 1.86/2230
19/05/26 - 07:39:14 - pyGIMLi - INFO - min/max (error): 1%/211%
19/05/26 - 07:39:14 - pyGIMLi - INFO - min/max (start model): 96.19/96.19
--------------------------------------------------------------------------------
19/05/26 - 07:39:32 - pyGIMLi - INFO - inv.iter 0 ... chi² = 6933.37
--------------------------------------------------------------------------------
inv.iter 1 ... 19/05/26 - 07:39:34 - pyGIMLi - INFO - chi² =  142.77 (dPhi = 97.93%) lam: 10.0
--------------------------------------------------------------------------------
inv.iter 2 ... 19/05/26 - 07:39:49 - pyGIMLi - INFO - chi² =   18.35 (dPhi = 87.05%) lam: 10.0
--------------------------------------------------------------------------------
inv.iter 3 ... 19/05/26 - 07:40:04 - pyGIMLi - INFO - chi² =    1.68 (dPhi = 89.43%) lam: 10.0
--------------------------------------------------------------------------------
inv.iter 4 ... 19/05/26 - 07:40:20 - pyGIMLi - INFO - chi² =    1.46 (dPhi = 12.32%) lam: 10.0
--------------------------------------------------------------------------------
inv.iter 5 ... 19/05/26 - 07:40:35 - pyGIMLi - INFO - chi² =    1.23 (dPhi = 14.45%) lam: 10.0
--------------------------------------------------------------------------------
inv.iter 6 ... 19/05/26 - 07:40:50 - pyGIMLi - INFO - chi² =    1.06 (dPhi = 10.84%) lam: 10.0
--------------------------------------------------------------------------------
inv.iter 7 ... 19/05/26 - 07:41:06 - pyGIMLi - INFO - chi² =    1.06 (dPhi = 0.11%) lam: 10.0
################################################################################
#                Abort criterion reached: dPhi = 0.11 (< 2.0%)                 #
################################################################################
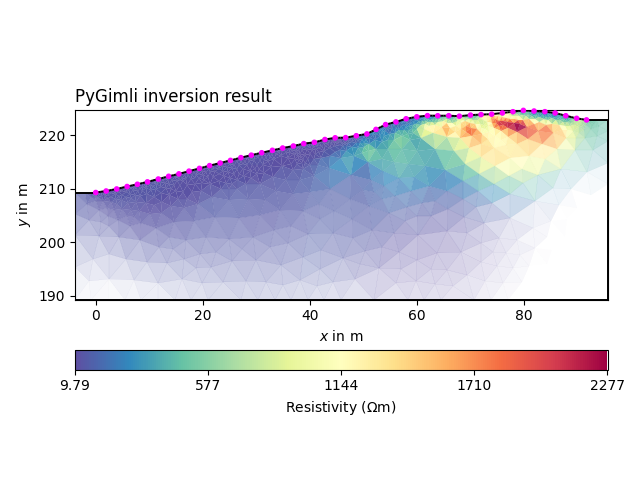
plot the result
with reda.CreateEnterDirectory('output_01_ertinv'):
    ax, cb = mgr.showResult(
        cMap="Spectral_r",
        logScale=False,
    )
    ax.set_title('PyGimli inversion result', loc='left')
    fig = ax.get_figure()
    fig.savefig('pygimli_inversion.jpg', dpi=300)
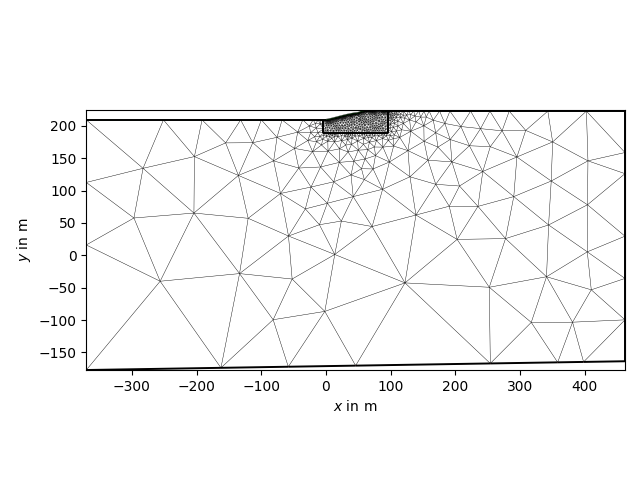
with reda.CreateEnterDirectory('output_01_ertinv'):
    ax, _ = pg.show(mgr.mesh)
    ax.get_figure().savefig('mesh.jpg', dpi=1200)
Total running time of the script: (1 minutes 54.680 seconds)