Note
Go to the end to download the full example code.
Visualizing multi-dimensional sEIT data
This is work in progress
imports
import reda
load the data set
Summary:
                  a             b  ...     frequency          rpha
count  21090.000000  21090.000000  ...  21090.000000  21090.000000
mean      20.000000     21.000000  ...    106.285593     -0.416545
std       11.269695     11.269695  ...    257.160101      3.894778
min        1.000000      2.000000  ...      0.001000    -36.449777
25%       10.000000     11.000000  ...      0.019307      0.001337
50%       20.000000     21.000000  ...      1.000000      0.152537
75%       30.000000     31.000000  ...     51.794747      0.904502
max       39.000000     40.000000  ...   1000.000000      9.153910

[8 rows x 7 columns]
Summary:
                  a             b  ...     frequency          rpha
count  21090.000000  21090.000000  ...  21090.000000  21090.000000
mean      20.000000     21.000000  ...    106.285593     -0.271940
std       11.269695     11.269695  ...    257.160101      0.695746
min        1.000000      2.000000  ...      0.001000     -4.414486
25%       10.000000     11.000000  ...      0.019307     -0.263819
50%       20.000000     21.000000  ...      1.000000      0.001008
75%       30.000000     31.000000  ...     51.794747      0.042757
max       39.000000     40.000000  ...   1000.000000      0.547236

[8 rows x 7 columns]
Summary:
                  a             b  ...     frequency          rpha
count  21090.000000  21090.000000  ...  21090.000000  21090.000000
mean      20.000000     21.000000  ...    106.285593     -0.146598
std       11.269695     11.269695  ...    257.160101      0.262500
min        1.000000      2.000000  ...      0.001000     -1.449444
25%       10.000000     11.000000  ...      0.019307     -0.188202
50%       20.000000     21.000000  ...      1.000000     -0.020179
75%       30.000000     31.000000  ...     51.794747      0.002784
max       39.000000     40.000000  ...   1000.000000      0.151707

[8 rows x 7 columns]
Summary:
                  a             b  ...     frequency          rpha
count  21090.000000  21090.000000  ...  21090.000000  21090.000000
mean      20.000000     21.000000  ...    106.285593     -0.073887
std       11.269695     11.269695  ...    257.160101      0.130434
min        1.000000      2.000000  ...      0.001000     -0.711277
25%       10.000000     11.000000  ...      0.019307     -0.095615
50%       20.000000     21.000000  ...      1.000000     -0.007987
75%       30.000000     31.000000  ...     51.794747      0.001270
max       39.000000     40.000000  ...   1000.000000      0.051985

[8 rows x 7 columns]
Plotting pseudosections
with reda.CreateEnterDirectory('output_visualize_4d'):
    pass
    print(
        'at this point the plotting routines do not honor'
        ' timestep dimensionality'
    )
at this point the plotting routines do not honor timestep dimensionality
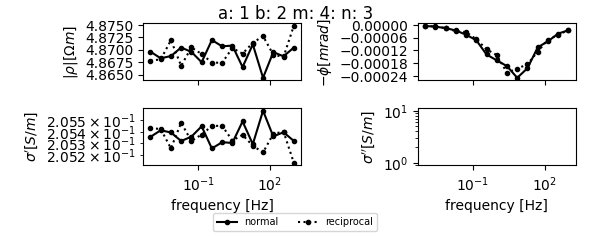
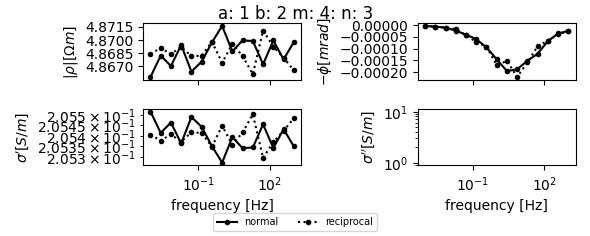
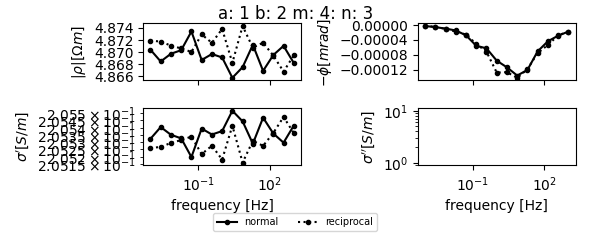
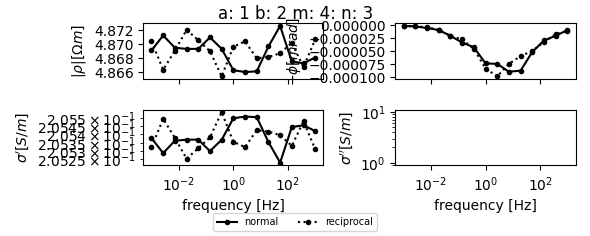
Plot a single spectrum
nor, rec = seit.get_spectrum(abmn=[1, 2, 4, 3])

with reda.CreateEnterDirectory('output_visualize_4d'):
    for timestep, spectrum in nor.items():
        spectrum.plot(filename='spectrum_1-2_4-3_ts_{}.png'.format(timestep))

with reda.CreateEnterDirectory('output_visualize_4d'):
    nor, rec, fig = seit.get_spectrum(
        abmn=[1, 2, 4, 3], plot_filename='specplot.png'
    )
/home/runner/.virtualenvs/reda/lib/python3.10/site-packages/reda/eis/plots.py:217: UserWarning: Data has no positive values, and therefore cannot be log-scaled.
  ax.set_ylim(
/home/runner/.virtualenvs/reda/lib/python3.10/site-packages/reda/eis/plots.py:217: UserWarning: Data has no positive values, and therefore cannot be log-scaled.
  ax.set_ylim(
/home/runner/.virtualenvs/reda/lib/python3.10/site-packages/reda/eis/plots.py:235: UserWarning: linestyle is redundantly defined by the 'linestyle' keyword argument and the fmt string ".-" (-> linestyle='-'). The keyword argument will take precedence.
  axes[0, 0].semilogx(
/home/runner/.virtualenvs/reda/lib/python3.10/site-packages/reda/eis/plots.py:250: UserWarning: linestyle is redundantly defined by the 'linestyle' keyword argument and the fmt string ".-" (-> linestyle='-'). The keyword argument will take precedence.
  axes[0, 1].semilogx(
/home/runner/.virtualenvs/reda/lib/python3.10/site-packages/reda/eis/plots.py:265: UserWarning: linestyle is redundantly defined by the 'linestyle' keyword argument and the fmt string ".-" (-> linestyle='-'). The keyword argument will take precedence.
  axes[1, 0].loglog(
/home/runner/.virtualenvs/reda/lib/python3.10/site-packages/reda/eis/plots.py:279: UserWarning: linestyle is redundantly defined by the 'linestyle' keyword argument and the fmt string ".-" (-> linestyle='-'). The keyword argument will take precedence.
  axes[1, 1].loglog(
/home/runner/.virtualenvs/reda/lib/python3.10/site-packages/reda/eis/plots.py:288: UserWarning: Data has no positive values, and therefore cannot be log-scaled.
  axes[1, 1].set_ylim(
from reda.eis.plots import multi_sip_response
# important: use the obj_dict parameter to use a dict as input
multi = multi_sip_response(obj_dict=nor)
with reda.CreateEnterDirectory('output_visualize_4d'):
    multi.plot_cre('multiplot_cre.png')
    multi.plot_cim('multiplot_cim.png')
    multi.plot_rmag('multiplot_rmag.png')
    multi.plot_rpha('multiplot_rpha.png')
/home/runner/.virtualenvs/reda/lib/python3.10/site-packages/reda/eis/plots.py:536: UserWarning: Data has no positive values, and therefore cannot be log-scaled.
  ax.set_xlim(*self.xlim)
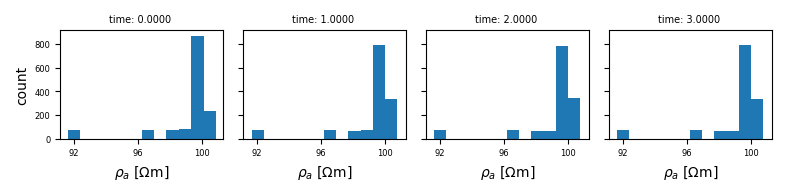
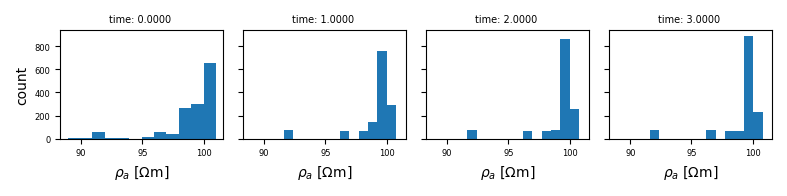
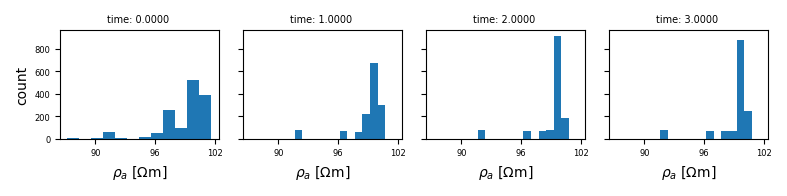
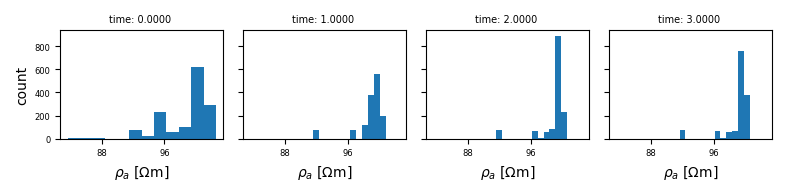
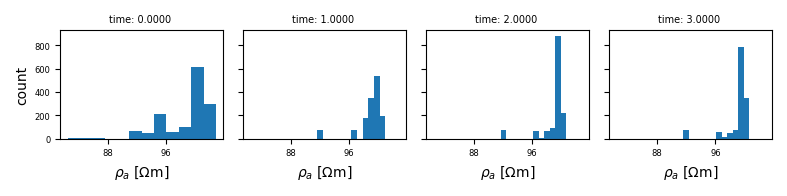
Histograms just used to close the figures to save memory
import pylab as plt
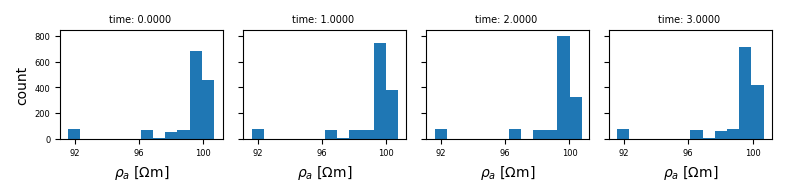
with reda.CreateEnterDirectory('output_visualize_4d'):
# plot frequencies in one plot
name, figs = seit.plot_histograms('rho_a', 'frequency')
for ts, fig in sorted(figs.items()):
fig.savefig(name + '_lin_{}.jpg'.format(ts), dpi=200)
plt.close(fig)
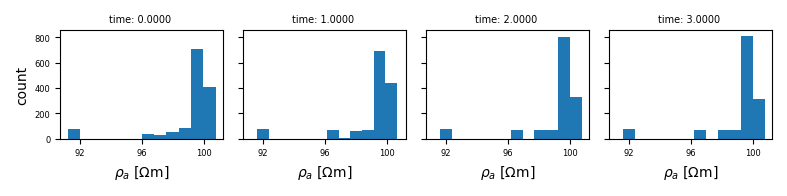
# plot in log10 representation
name, figs = seit.plot_histograms('rho_a', 'frequency', log10=True)
for ts, fig in sorted(figs.items()):
fig.savefig(name + '_log10_{}.jpg'.format(ts), dpi=200)
plt.close(fig)
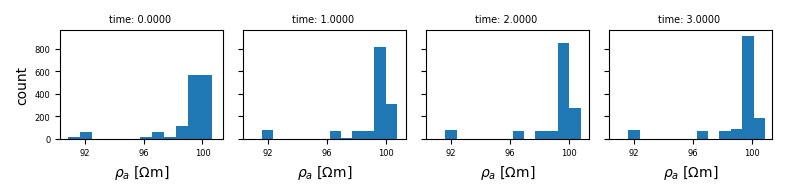
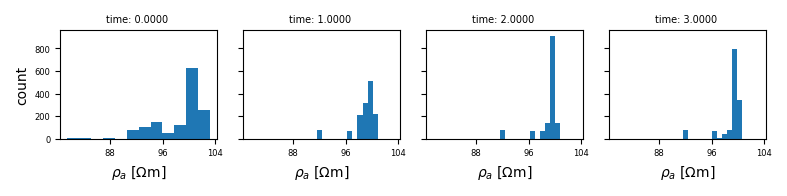
name, figs = seit.plot_histograms('rho_a', 'timestep')
# plot only each third plot
for ts, fig in sorted(figs.items())[0::3]:
fig.savefig(name + '_{}.jpg'.format(ts), dpi=200)
plt.close(fig)

Total running time of the script: (0 minutes 16.917 seconds)